
まさか、グラフのライブラリがあったなんてと思ったら、オープンソースのR言語を記述して作成するらしい。
まず必要なのが、これ
MRO (Microsoft R Open) からダウンロードし実行します。
https://mran.revolutionanalytics.com/download/#download
※MRO は 64bit 版のみ。
Ubuntuもある。
通常だとC:\Program Files\Microsoft\MRO\R-3.2.5にインスコされる。
次にC#から利用できるように、R.netのライブラリーを導入。

あまりにも簡単にできてしまって、嬉しくなりました。
using System;
using System.Drawing;
using System.Windows.Forms;
using RDotNet;
using System.Text;
namespace rnet
{
public partial class Form1 : Form
{
//一時的に保存する画像のパス
private string imgPath = @”c:\\temp\\RD.png”;
private REngine engine;
public Form1()
{
InitializeComponent();
}
private void Form1_Load(object sender, EventArgs e)
{
REngine.SetEnvironmentVariables();
engine = REngine.GetInstance();
}
private void button1_Click(object sender, EventArgs e)
{
Hist();
}
private void Form1_FormClosed(object sender, FormClosedEventArgs e)
{
engine.Dispose();
}
private void Hist()
{
//平均値 50、標準偏差 10 の正規乱数を 1000 個生成
var x = engine.Evaluate(“x <- rnorm(1000, mean=50, sd=10)”).AsNumeric();
var y = engine.Evaluate(“y <- rnorm(1000, mean=40, sd=20)”).AsNumeric();
//ヒストグラムを生成し画像ファイルを保存
engine.Evaluate(String.Format(@”png(‘{0}’, width={1}, height={2}, bg=’transparent’);”, imgPath, pictureBox1.Width, pictureBox1.Height));
engine.Evaluate(“hist(x, col = ‘orange’, border = ‘#ff00ff’, main = ‘ヒストグラム’, breaks= ‘Scott’)”);
engine.Evaluate(“hist(y, col = ‘#0000ff40’, border = ‘#0000ff’, breaks = 20, add = T)”);
engine.Evaluate(“graphics.off();”);
//生成した画像を表示
DrawPicture();
}
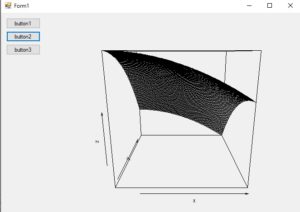
private void Persp()
{
var x = engine.Evaluate(“x <- 1:100”).AsNumeric();
var y = engine.Evaluate(“y <- 5:105″).AsNumeric();
//3次元グラフを生成し画像ファイルを保存
engine.Evaluate(String.Format(@”png(‘{0}’, width={1}, height={2}, bg=’transparent’);”, imgPath, pictureBox1.Width, pictureBox1.Height));
engine.Evaluate(“model = function (a,b){24.77+6.525*b-3.542*a-7.651*b^2-4.1932*a^2}”);
engine.Evaluate(“z = outer(x, y ,model)”);
engine.Evaluate(“persp(x,y,z)”);
engine.Evaluate(“graphics.off();”);
//生成した画像を表示
DrawPicture();
}
private void Pie()
{
//平均値 60、標準偏差 15 の正規乱数を 20 個生成
var x = engine.Evaluate(“x <- rnorm(20, mean=60, sd=15)”).AsNumeric();
//円グラフを生成し画像ファイルを保存
engine.Evaluate(String.Format(@”png(‘{0}’, width={1}, height={2}, bg=’transparent’);”, imgPath, pictureBox1.Width, pictureBox1.Height));
engine.Evaluate(“pie(x, r = 1, col = rainbow(10))”);
engine.Evaluate(“graphics.off();”);
//生成した画像を表示
DrawPicture();
}
private void cont()
{
double[] data = { 1.11, 2.22, 3.33, 4.44, 5.55, 6.66, 7.77, 8.88, 9.99, 10.10 };
var x = engine.CreateNumericVector(data);
engine.SetSymbol(“x”, x);
var y = engine.Evaluate(“y <- c(2, 4, 6, 8, 10, 12, 14, 16, 18, 20)”).AsNumeric();
//Rで実行する文字列の作成
StringBuilder command = new StringBuilder();
command.Append(String.Format(@”png(‘{0}’, width={1}, height={2}, bg=’transparent’);”, imgPath, pictureBox1.Width, pictureBox1.Height));
command.Append(“equation = function (a, b){12.3+10.51*b-4.485*a-2.983*b^2-1.298*a^3};”);
command.Append(“z = outer(x, y, equation);”);
command.Append(“contour(x, y, z, nlevels = 10, labcex = 1);”);
command.Append(“graphics.off();”);
//Rによるコンター図の作成
engine.Evaluate(command.ToString());
//生成した画像を表示
DrawPicture();
//画像の表示処理
}
private void hg1()
{
double[] data = { 1, 2, 3, 4, 5, 6, 7, 8, 9, 10 };
var x = engine.CreateNumericVector(data);
StringBuilder command = new StringBuilder();
command.Append(String.Format(@”png(‘{0}’, width={1}, height={2}, bg=’transparent’);”, imgPath, pictureBox1.Width, pictureBox1.Height));
command.Append(@”x <- 1:10;”);
command.Append(@”plot(x);”);
command.Append(“graphics.off();”);
engine.Evaluate(command.ToString());
//生成した画像を表示
DrawPicture();
}
private void DrawPicture()
{
//画像の表示処理
using (System.IO.StreamReader str = new System.IO.StreamReader(imgPath))
{
this.pictureBox1.Image = new Bitmap(str.BaseStream);
str.Close();
}
this.pictureBox1.Invalidate();
}
private void button2_Click(object sender, EventArgs e)
{
Persp();
}
private void button3_Click(object sender, EventArgs e)
{
Pie();
}
private void button4_Click(object sender, EventArgs e)
{
cont();
}
private void button5_Click(object sender, EventArgs e)
{
hg1();
}
}
}